

The wise assert that: “While climate is dictated by the sun and the earth’s axial tilt, weather is dictated by the tropical planetary waves.”
While at most instances, the term “climatology” can be construed as governed by the natural law driving atmospheric features and oceanic currents, and the “ensuing weather”just follows the rules written therein, there are plenty of outliers as well that become evident at various geographic regions in the world. Outliers, especially are of the form of anomalous positive temperatures during winter, anomalously cooler conditions during summers, anomalously wet/dry weather, etc. Here, if one carefully observes, the term ‘anomalous’ in describing weather of a particular bounded region is used as a comparison to the normal climate derived from tons of observational data that has been taken across centuries. This suggests that while weather majorly follows the arc of climatology, there are exceptions when it does not, and the reason for these outliers are: TROPICAL PLANETARY WAVES.
Climate has to be understood as low-frequency seemingly-static atmospheric state means (all but not limited to: pressure, wind, rainfall, temperature) that take months to change, the reason for the evolution of seasons. To the contrary, weather has to be understood as dynamic high frequency variabilities in the aforementioned atmospheric states, potentially causing extremes, that are majorly triggered by the propagation of tropical planetary waves. The immediate follow-up question is “So how are these tropical waves that dictate the weather across geographies tracked?”.
THE ORIGIN OF HOVMÖLLER DIAGRAMThe ocean of weather enthusiasts available today are well-aware of the role tropical waves play in modulating weather conditions. While most are obsessed to one of the distinct tropical wave – Madden-Julian Oscillation (MJO), it is imperative to point here that atmospheric Rossby wave trains and tropical kelvin waves were identified almost, three decades and a decade respectively, prior to the spotting of MJO. But, did you know the tool that played an important role to map and forecast the evolution of these tropical planetary waves were the HOVMÖLLER DIAGRAM?
It is attributed to the renowned meteorologist Ernest Hovmöller (1912–2008) who first constructed this diagram on 1948. It was initially a spatio-temporal construction (featuring Y-X axis: time-longitude or latitude-time) of single atmospheric variables like wind and geopotential anomalies that was used to study sub-tropical Rossby wave trains featuring the jet stream mechanisms and their impact on weather in the US & UK. In recent years, due to its utility, the Hovmöller plots have been extended for tracking other variables such as OLR, Velocity Potential, among others. The latitude-months version of the Hovmöllers gives insights on the global tropical conveyor belt, which is the ITCZ. This is clearly elaborated on this NOAA post on Hovmöllers as climate scientist’s best friend and specifically to track ISMR in this WCRP slide deck.
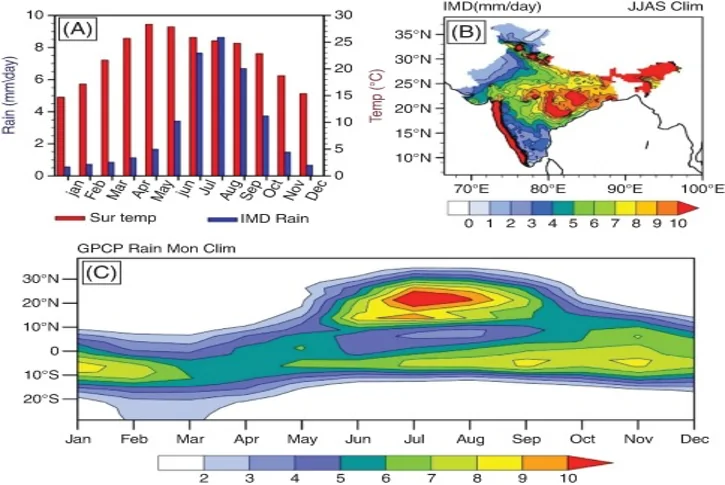
So, what is the utility of the Hovmöllers?